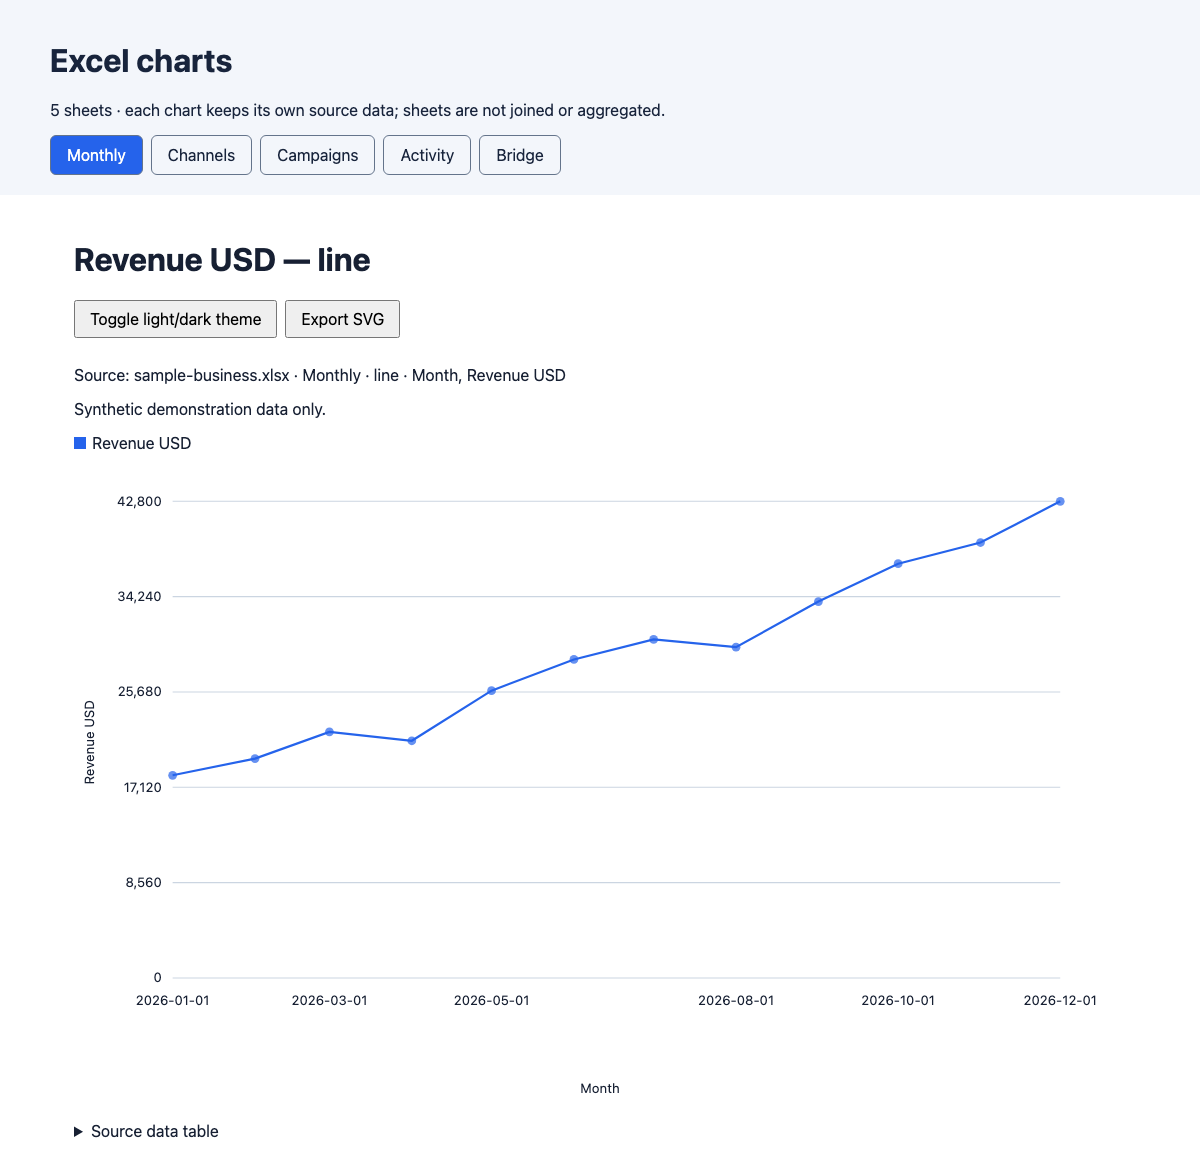
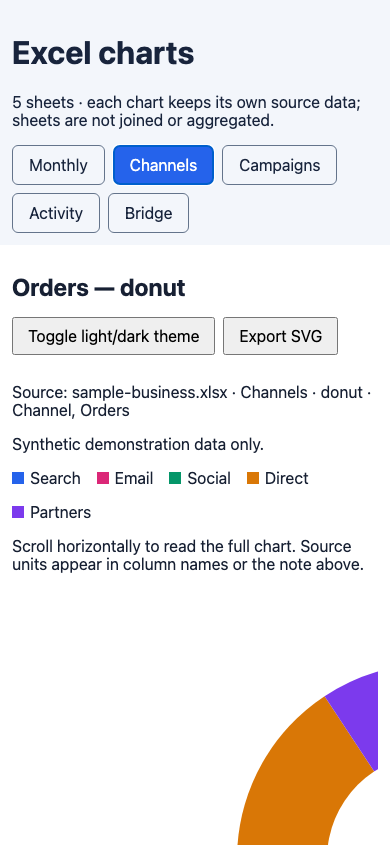
Actual screenshots of offline HTML generated from a synthetic Excel workbook. All numbers are fictional. The isolated Codex trial used gpt-6.1-sol; identical commands were rerun after axis-label and legend improvements. Six representative charts were browser-checked at desktop and phone widths, including themes, keyboard tooltips, data tables and SVG export. Fourteen chart types generated successfully; no unassisted-model comparison was performed. Multi-sheet update: five sheets converted into one tabbed HTML by Codex (GPT-6), with keyboard navigation and phone layout checked. Selecting six or duplicate sheets is rejected. Source data is synthetic.
Multiple sheets and input limits
Convert 1–5 selected sheets into one offline HTML file with sheet tabs. Each sheet has its own chart and source table. Sheets are not joined or aggregated; a workbook with more than five sheets requires an explicit selection of up to five.
- Per sheet: 10,000 worksheet rows including the header; 256 columns; 200,000 stored cells (formatted empty cells also count toward this safety limit).
- Per chart: 2,000 source data rows. Over-limit inputs are rejected, not silently sampled.
- First row must be unique column headers. Only .xlsx is supported. No macros or formula recalculation.
Five selected sheets were actually converted and checked in a browser, including switching tabs, keyboard navigation, source tables and phone width. Six-sheet, duplicate-sheet, row, column and stored-cell over-limit rejection were checked.
Choose a sheet and fields, then generate a shareable HTML file. Supports bar, grouped/stacked bar, line, area, pie, donut, scatter, bubble, histogram, box, heatmap, waterfall and radar charts when the data fits.
Actual results from a synthetic Excel workbook
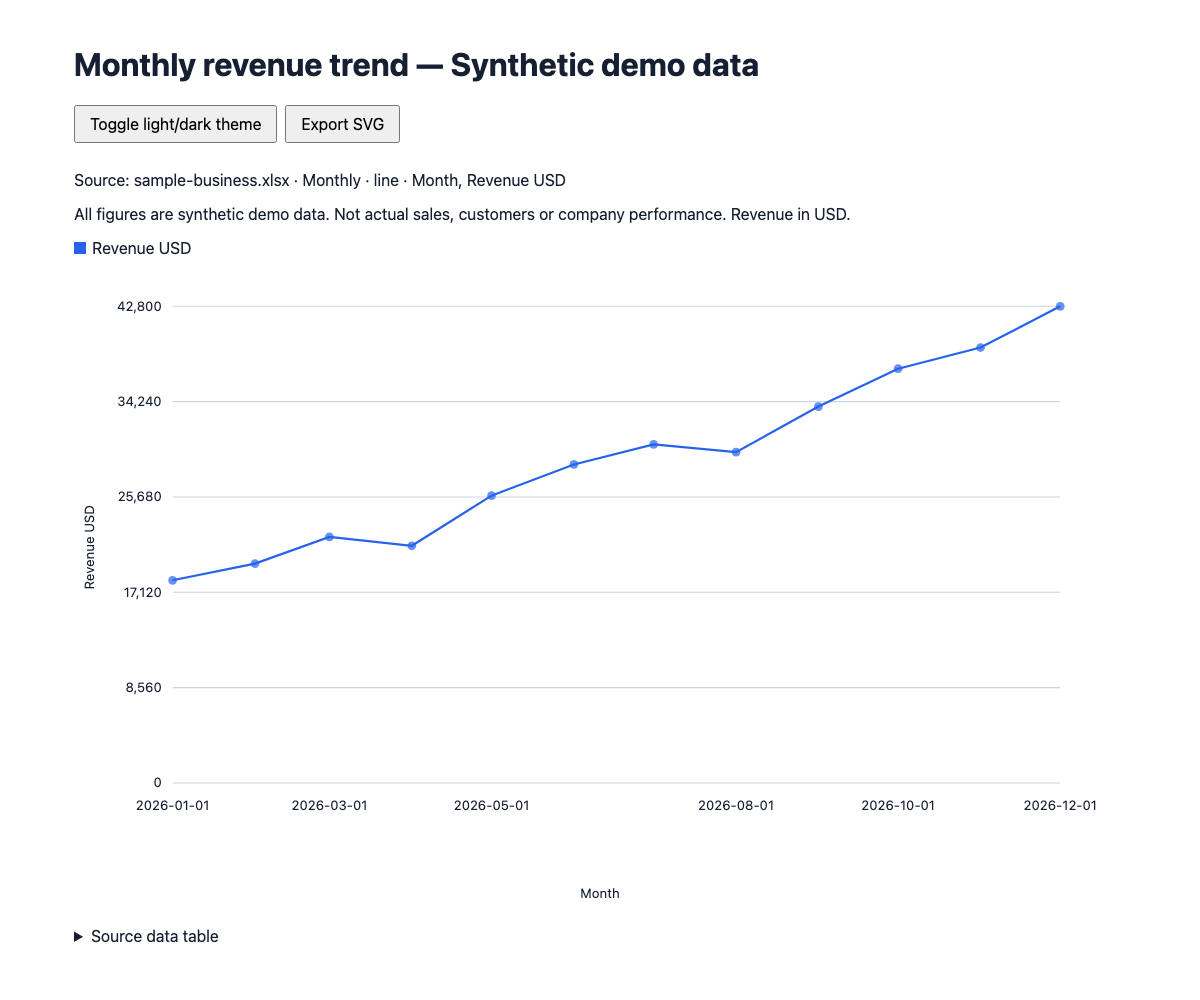
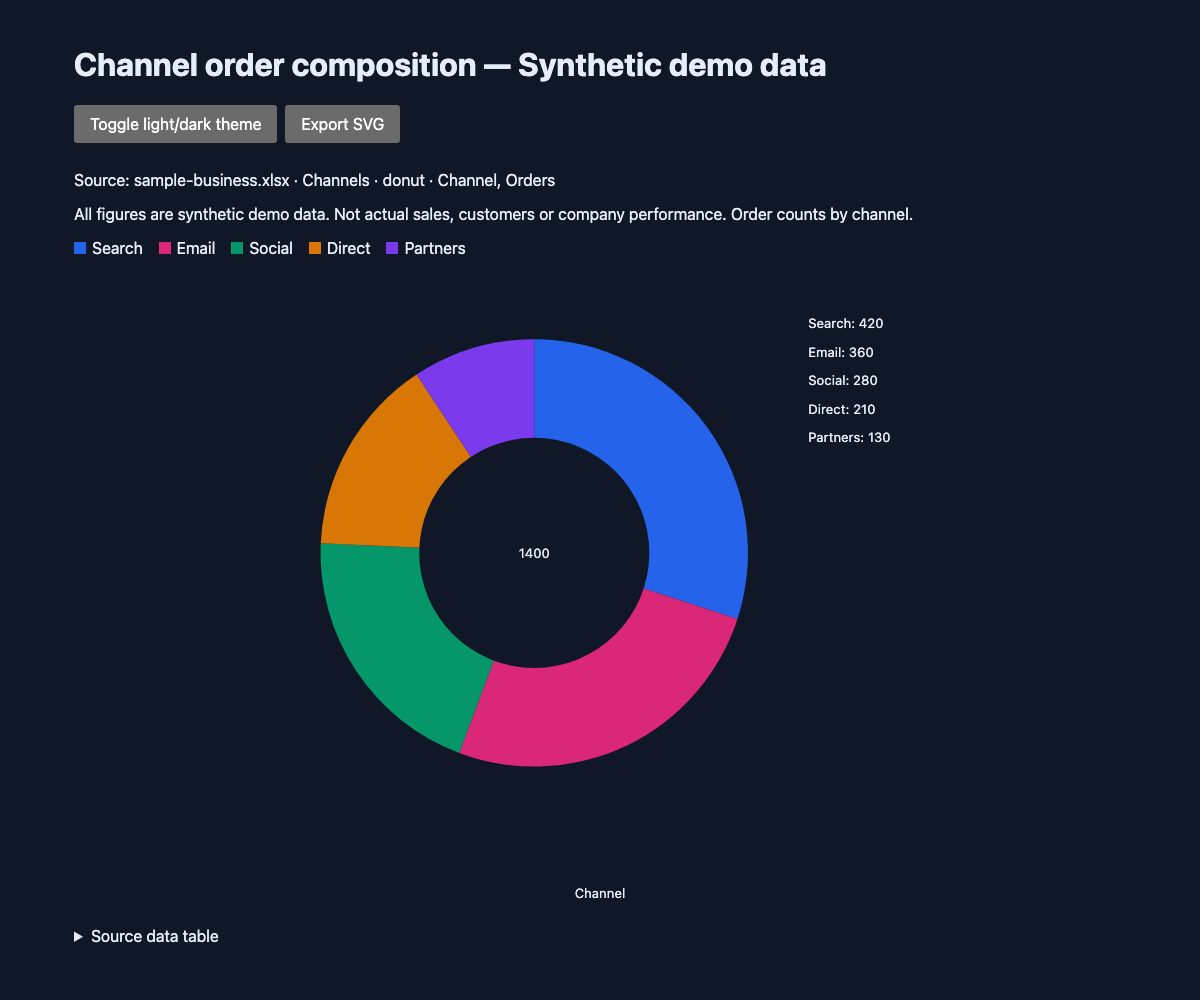
The images below are screenshots of HTML files actually generated from sample-business.xlsx. Every value is fictional demonstration data; these are not business results.
| Month | Revenue USD | Costs USD | Profit USD |
|---|---|---|---|
| 2026-01-01 | 18,200 | 12,600 | 5,600 |
| 2026-02-01 | 19,700 | 13,200 | 6,500 |
| 2026-03-01 | 22,100 | 14,000 | 8,100 |
Monthly revenue · light theme
Channel composition · dark theme
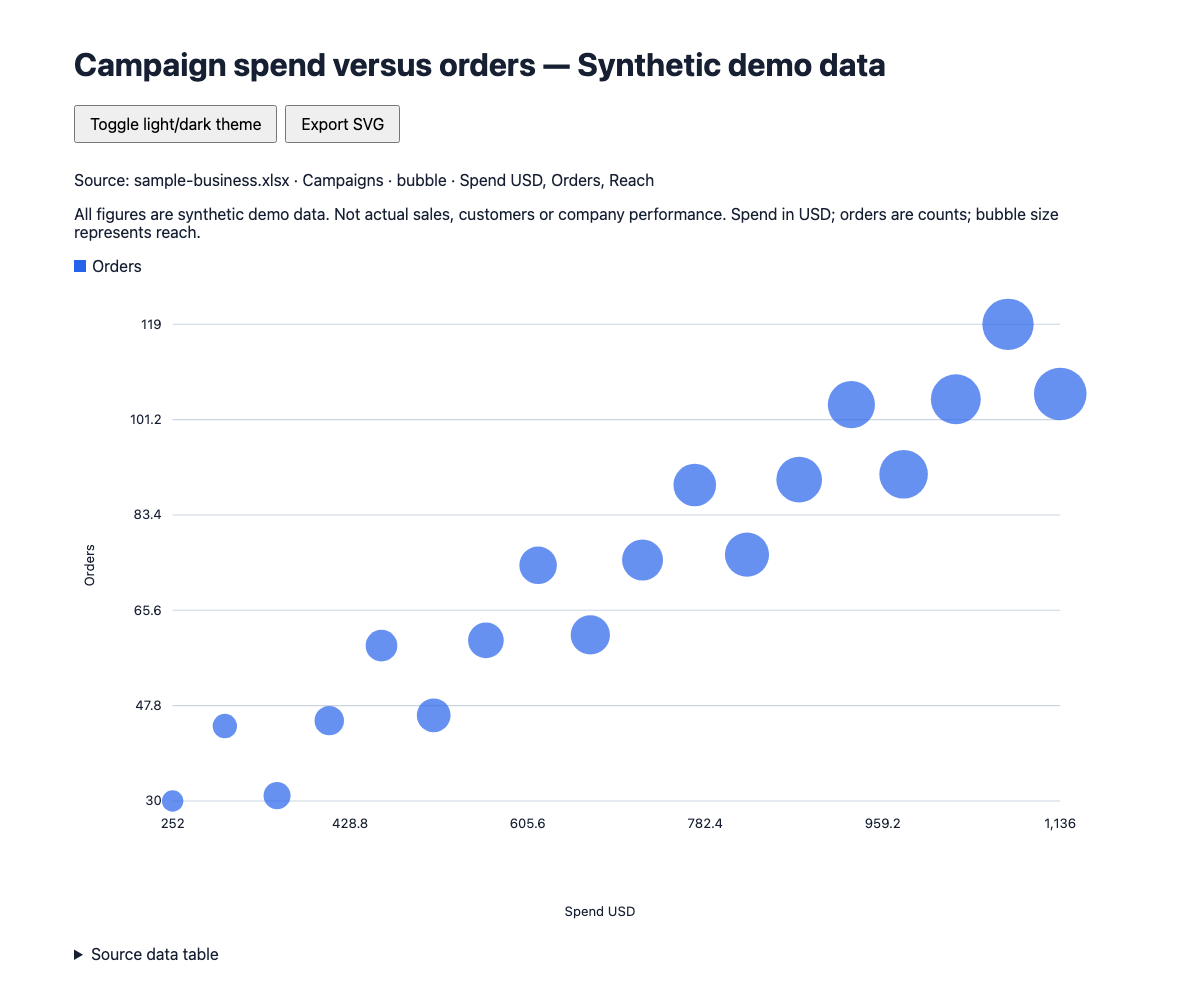
Campaign spend vs orders · bubble chart
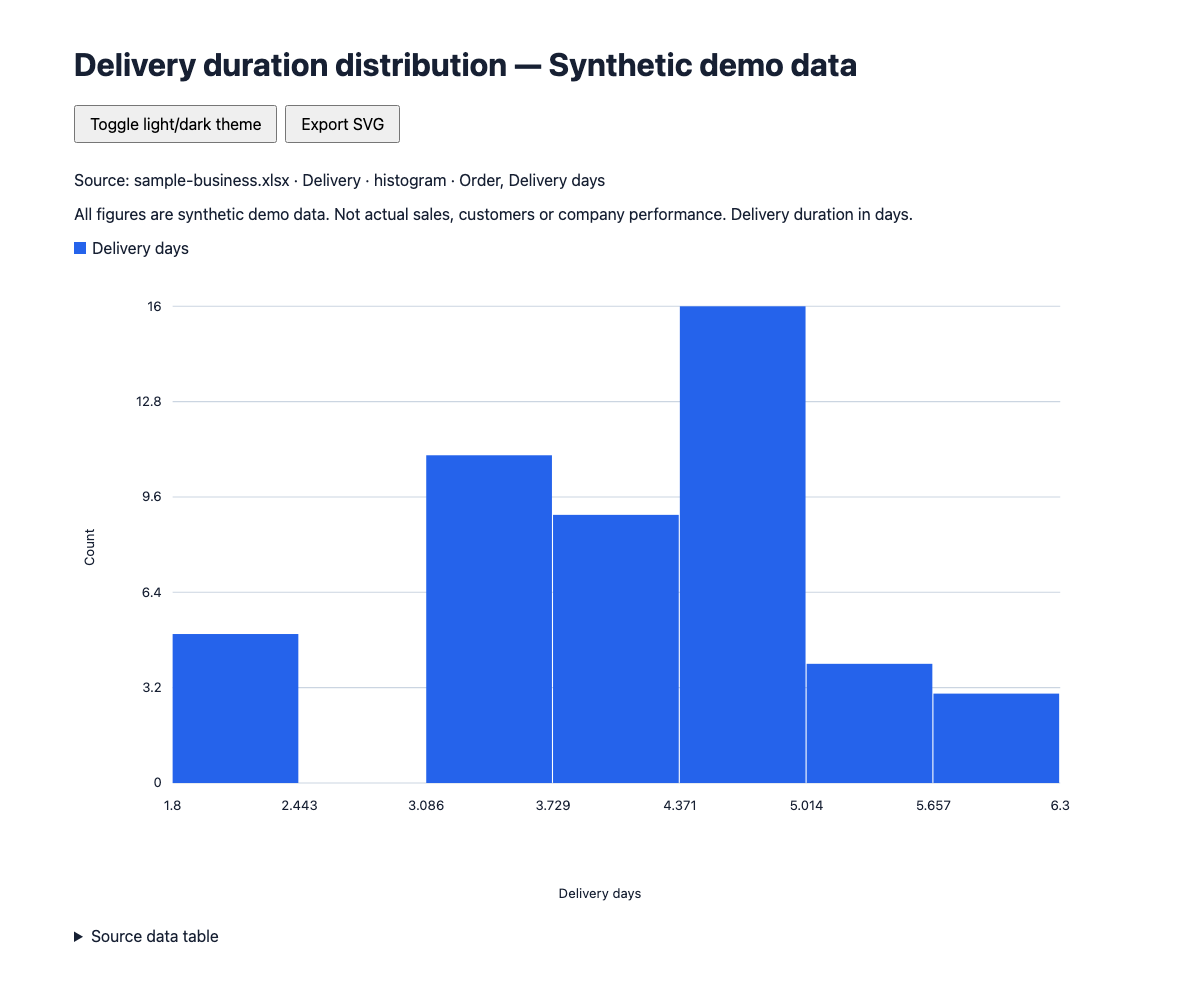
Delivery time distribution · histogram
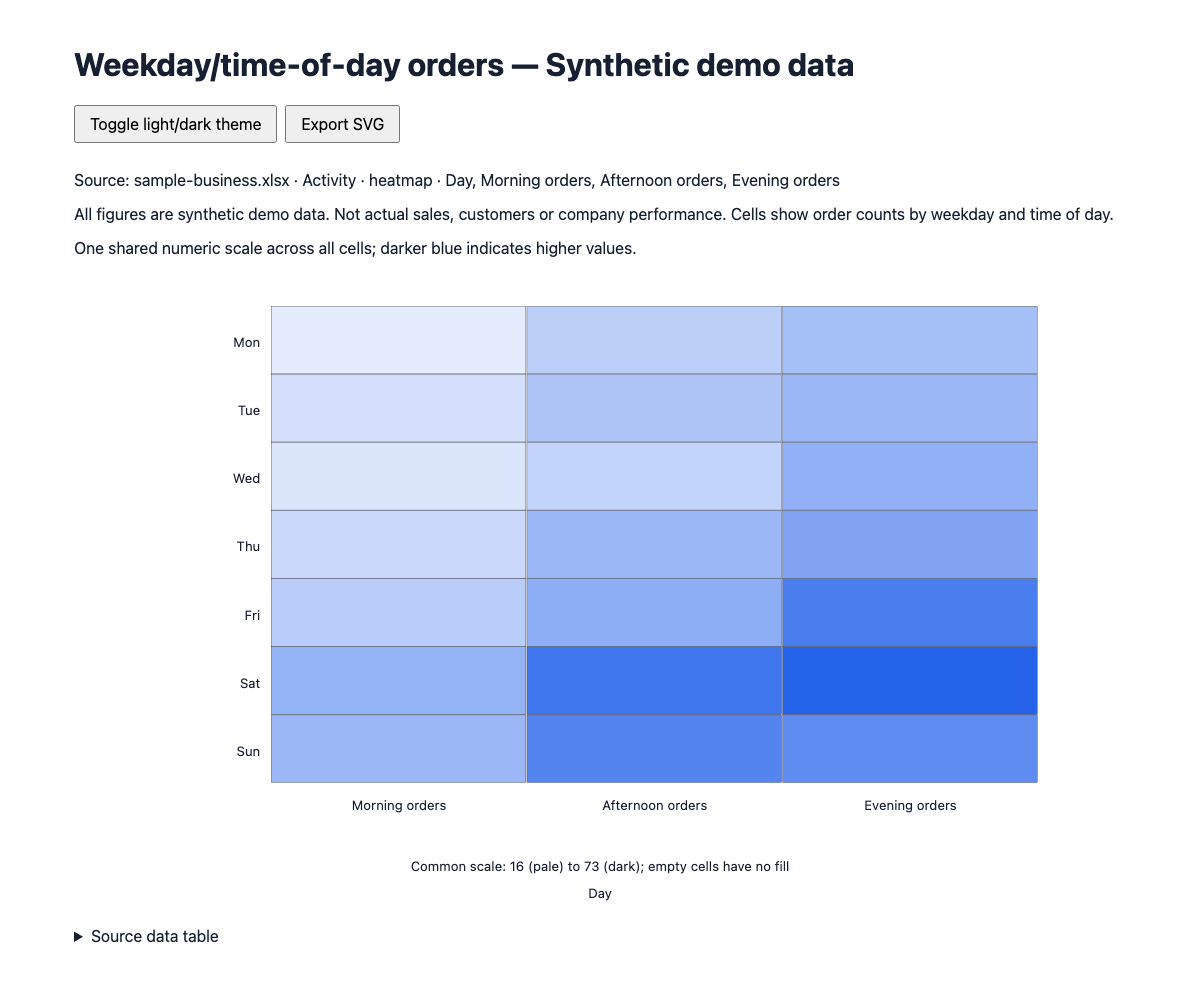
Weekday orders · heatmap
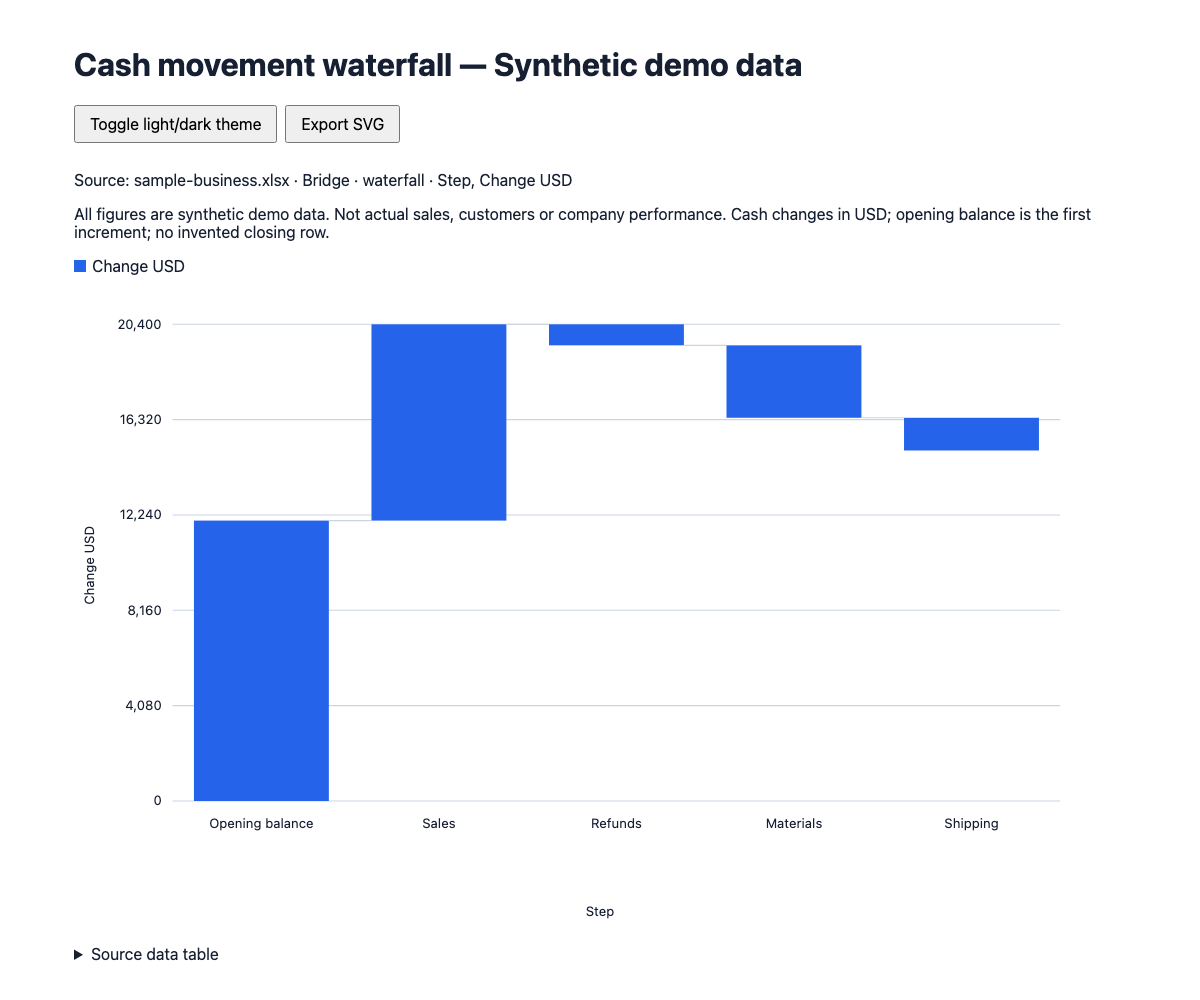
Cash movement · waterfall
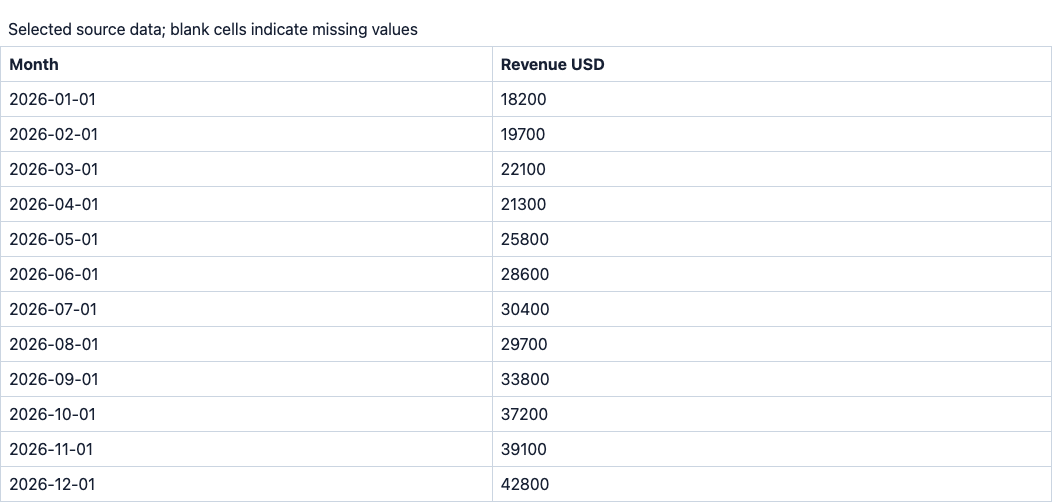
Selected source data table
Tested with one synthetic workbook. Fourteen chart types generated and parsed; six representative outputs checked in a browser at desktop and phone widths, including theme switching, keyboard tooltips, source tables and SVG export. No external browser requests were observed. Does not retain Excel cell display formatting: a stored percentage such as 0.15 remains a fraction, not 15. Charts are limited to 2,000 source rows; merged/multi-row headers need cleaning first. No comparison against an unassisted model has been performed.
Medium risk: runs a bundled Python 3 script that reads your selected .xlsx and optional JSON plan locally, then writes one HTML file. No network, accounts, secrets, macros or formula recalculation. Existing output is refused unless overwrite is explicitly requested. The HTML embeds selected source data: review it before sharing. Choose 1–5 sheets; no cross-sheet joins. Per sheet: 10,000 rows including header, 256 columns, 200,000 stored cells (formatted blanks count). Per chart: 2,000 data rows. Oversized data is rejected. Percentages remain stored fractions. Multi-sheet output was tried on synthetic data; limits and details are documented below.